Ra/Rz Surface Roughness

Barcode on cylinder

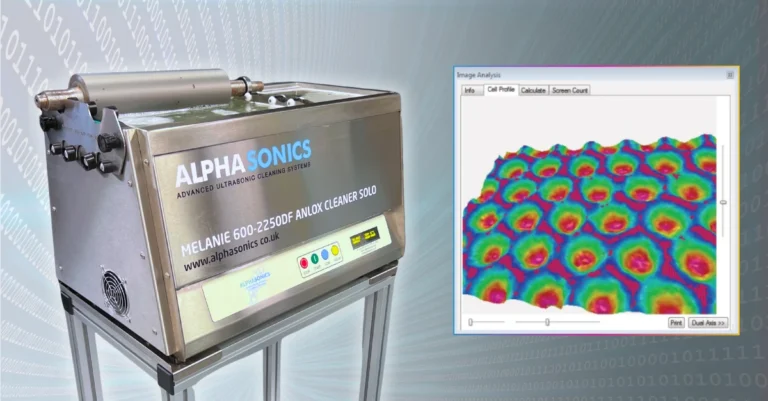
Surface roughness analysis software for rolls, cylinders, plates and coated substrates. It measures Ra, Rz, RPc, Rsk and Rku from one 3D scan, accurate to about 1 µm.

Inspect rolls and cylinders and detect wear and surface faults early, to save money and reduce downtime.

New to Ra and Rz? Read our guide, Ra vs Rz: what your surface roughness numbers are telling you.

Surface Checks for Better Coating

Ready to coat. Ready to run.

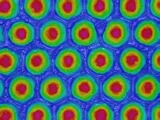
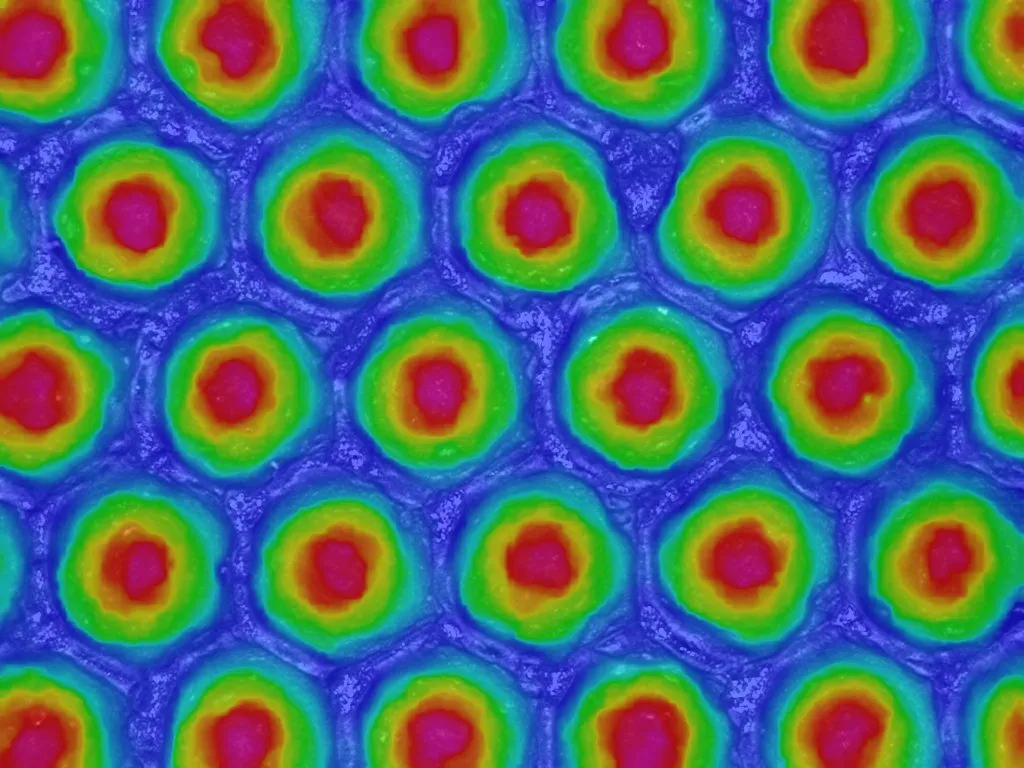
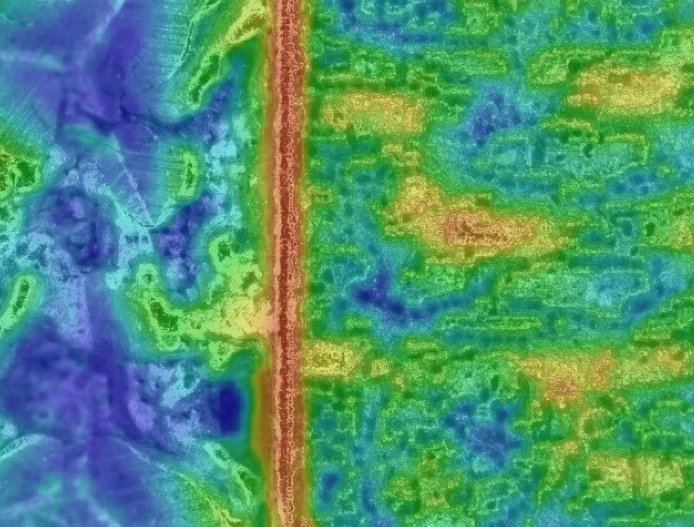
Letter engraved on a gravure cylinder, scanned in 3D

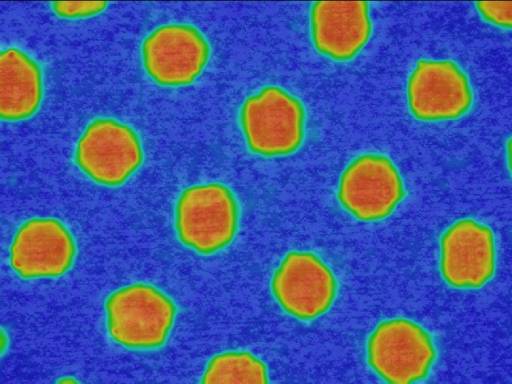
A coating is only as good as the surface under it. Check roughness and peak density on rolls, plates and substrates before you coat or laminate, and faults like voids and poor adhesion show up at inspection instead of on the finished job.

You get a clear reading before a roll goes on press, so set-up time is not wasted on a surface that was never going to work, and there is less scrap and rework to pay for.

Letter engraved on a gravure cylinder, scanned in 3D
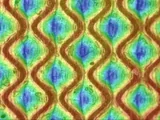
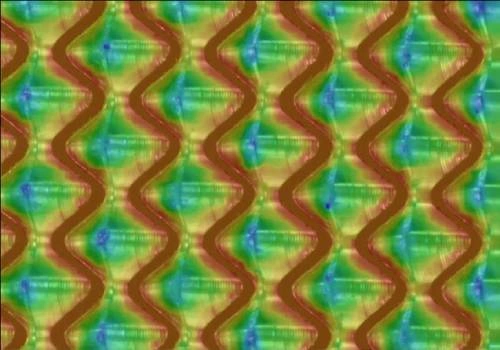
Scratches on chrome on gravure cylinder

Predictive Maintenance and Wear Monitoring

Stay ahead. Avoid downtime.

Scratches on chrome on gravure cylinder

Rolls and cylinders wear slowly, then fail suddenly. Measure Ra, Rz and RPc at regular intervals and the trend shows how fast each one is wearing.

Refurbishment and re-engraving can then be booked on evidence, at a time that suits the schedule, and rolls are not sent away for work they do not yet need. That means less unplanned downtime and longer life from every roll.

Ra, Rz and Peak Count

The average and the worst case.

Surface profile diagram showing the mean line, Ra, and the five peak-to-valley heights Rz1 to Rz5 that Rz averages

Ra tracks the overall texture, which makes it the number to trend over time. Rz catches the single pit or scratch that Ra averages away, the kind of fault that scraps a cylinder. RPc counts the peaks per centimetre, which decides how a coating or ink film sits on the surface.

All three are reported together for the same area, so one scan covers the quality check, and suppliers who quote Ra and customers who quote Rz both get the figure they expect.

Surface profile diagram showing the mean line, Ra, and the five peak-to-valley heights Rz1 to Rz5 that Rz averages
Two surface profiles compared: negative Rsk, a plateau with valleys cut into it, and positive Rsk, sharp peaks standing proud

Skewness and Kurtosis

The shape behind the number.

Two surface profiles compared: negative Rsk, a plateau with valleys cut into it, and positive Rsk, sharp peaks standing proud

Two surfaces with the same Ra can behave very differently on press. Rsk shows whether a surface is a plateau that holds coating or a field of peaks that wears fast. Rku shows how sharp those peaks are, and a high value warns of a surface that will wear quickly and wear whatever runs against it.

When a job goes wrong, these two numbers often explain why, so the cause is found first time and the same fault is not paid for twice.

Filtering and Sampling

Set once. Compare like with like.

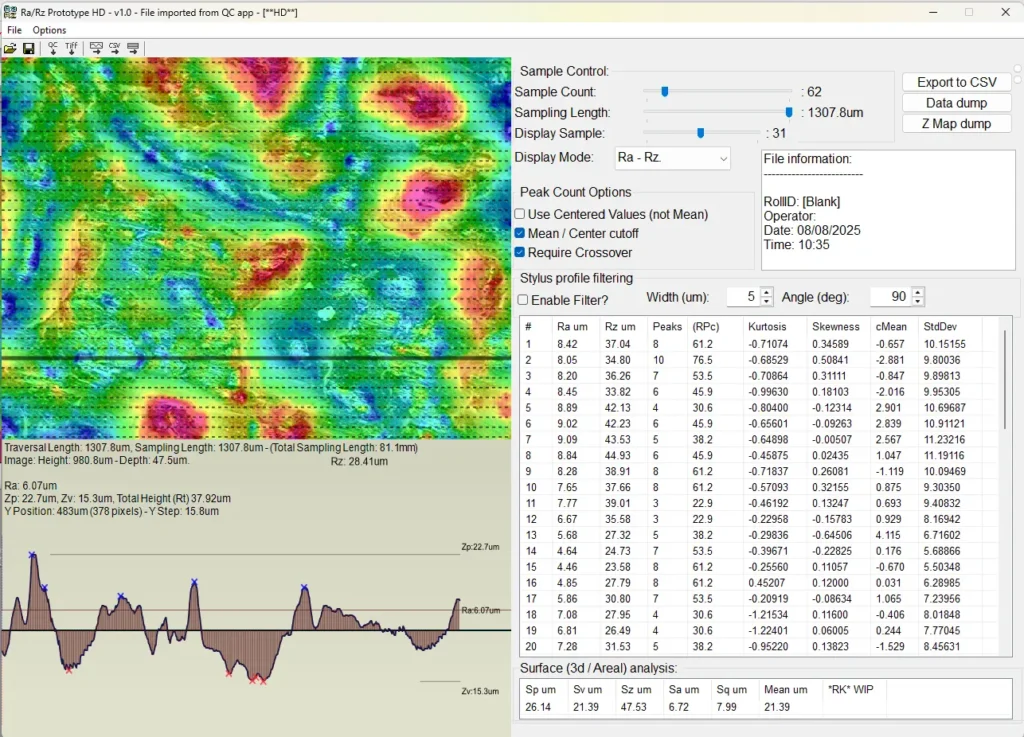
Ra, Rz and RPc results for a plastic panel measured with optical 3D measurement

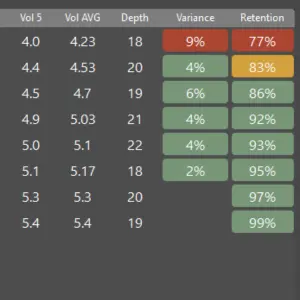
Click any point on the scan for instant values, or use the sample count slider to average readings across the surface, with individual and average results side by side.

A stylus-style filter, adjustable from 1 to 100 µm with 5 µm as standard, matches limits that were set on a stylus, without anything touching the roll. Your readings line up with your customers’ and suppliers’ figures, which makes acceptance checks quicker and disputes rarer.

Ra, Rz and RPc results for a plastic panel measured with optical 3D measurement